Study the graph carefully to answer the questions that follow. The following sub- divided bar diagram gives the number of students from 5 colleges having a separate liking for different drinks.
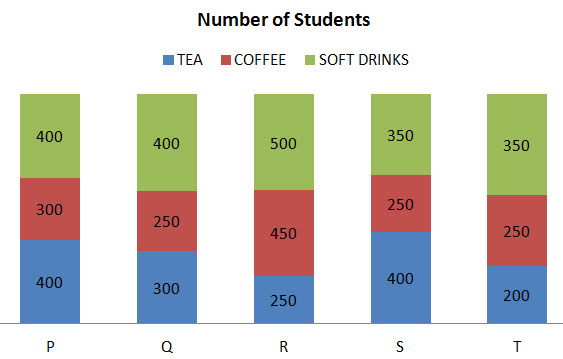
2 Q) "Total number of students of which college prefers maximum percentage of coffee? 1) T 2) S 3) R 4) P 5) Q"
3 Q) "The number of tea preferring students in college R is approximately what percentage of the total number of students who prefer tea, coffee and soft drink of the same college? 1) 18% 2) 21% 3) 23% 4) 17% 5) 25%"
4 Q) "The number of students who prefer tea in college Q is how much percent more than the number of students who prefer coffee of the same college? 1) 25% 2) 15% 3) 30% 4) 45% 5) None of these"
5 Q) "The number of students who prefer soft drink in college T is same as the number of students who prefer tea in which of the following colleges? 1) Q 2) S 3) P 4) R 5) None of these"
Also Read:
- Exercise 8: Line Graphs Data Interpretation
- Exercise 7: Line Graphs Data Interpretation
- Exercise 6: Line Graphs Data Interpretation
- Exercise 5: Line Graphs- Data Interpretation
- Exercise 4: Bar Graphs Data Interpretation
Advertisements
No comments:
Post a Comment